

The Australian mining and construction industries are expected to be among the leaders in production and productivity growth as 2016 shapes up to be a slow but better year than 2015, writes IBISWorld founder and director Phil Ruthven.

![]()
THIS year looks likely to be a better year than 2015, partly due to the recent FTA with China and the coming Transpacific Partnership agreement. The low Australian dollar will help, as will continuing low interest rates and, hopefully, continued rises in consumer and business confidence.
Australia needs a number of reforms to recreate the sort of growth we have become used to over the past century or so, at 3.5 percent per annum.
One of these is industrial relations reform of the regressive Fair Work legislation, which is more suited to our long-gone Industrial Age of pre-1965 rather than our new Infotronics Age.
Another is overdue taxation reform, which has been impeded by ignorance, vested interests, politics and a severe knowledge-deficiency in finance, taxation and economics in our unrepresentative Senate.
Yet another is reigniting innovation, entrepreneurship and productivity growth, although the Turnbull Government made big strides in December on these matters via the $1.0 billion innovation initiative and proposed changes to the over-penalising bankruptcy laws.
Of course, 2016 is an election year – expected late in the second half of the year – which brings the nation to a pregnant pause.
To forecast the economy’s performance in a new calendar year, we have to start with the marketplace.
Gone are the days of the production-push economy that we had in the Industrial Age up to the mid-1960s, or the Agrarian Age before the 1860s.
Now in the Infotronics Age, we have a market-pull economy based on services, underpinned by the utility of information and communications technology, compared with the goods-based economy underpinned by electricity and telecommunications in the Industrial Age.
This market and consumer power has been further strengthened by social media, fast broadband, big data and analytics, which emerged in the second stage of ICT in 2007 – the digital disruption era.
The main aggregates of the market at the most recent measure by the ABS are shown in the first chart.
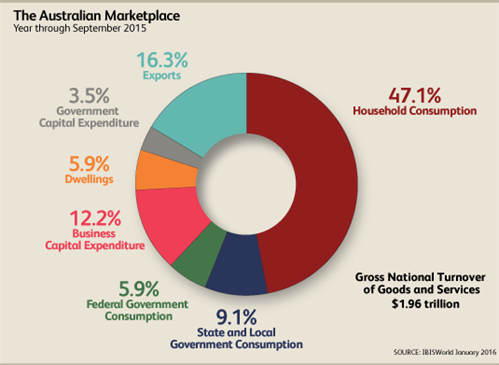
Our gross national turnover – comprised of our own gross national expenditure (GNE) on goods and services, plus exports (overseas expenditure) – should exceed $2.0 trillion for the first time by the end of 2016.
Our GDP should nudge $1.7 trillion with real growth over 2016 of some 2.5 percent, compared with an estimated 2.3 percent in 2015.
This growth is just over a third of the growth in our region of the Asia Pacific. But better than the OECD average, dragged down by the EU.
Inflation, measured by the GDP deflator, may be around 1 percent or a little higher in 2016, having been negative in 2014-15 and probably close to zero in calendar year 2015.
So what is happening to our market segments – which of them are growing, stumbling or declining?
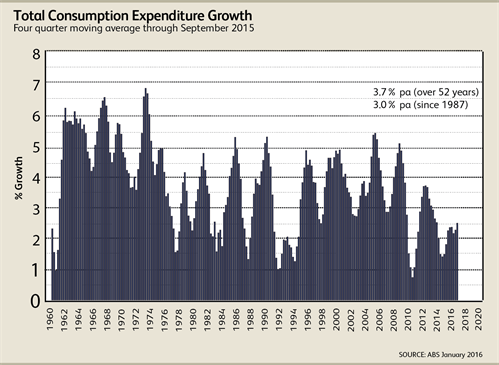
Consumption expenditure is expected to be some 62 percent of the total market, and growing at a hoped-for 3.5 percent.
Household spending is rising faster than in 2015 due to rising consumer confidence, a very popular new PM, less appetite for investment housing (a capital item), and governments at federal and state levels playing their part as well.
Consumption expenditure has never been negative over the past six decades, so the consumer has never caused a recession over that period.
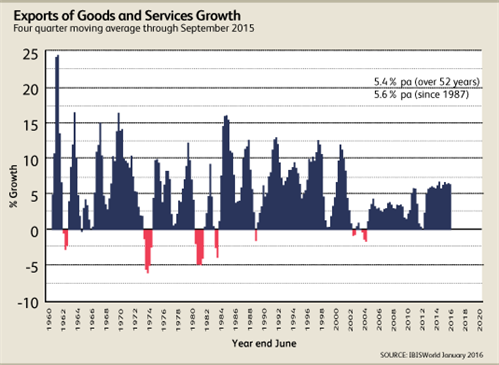
Exports, accounting for some 16 percent of the market, could grow as fast as 9 percent on the back of a low Australian dollar, fast-rising inbound tourism, further growth in mining export volumes – as separate from prices – and some manufactured foodstuffs.
And, of course, this will be helped by the new China FTA and TPP.
Agriculture, if El Nino is cranky, could cut into its exports, but since agricultural products are less than 10 percent of total exports these days, this would do less damage than in previous decades.
And, as the next chart shows, export growth rarely goes negative, and has therefore not been responsible for any recession over the past six or more decades.
The third market segment is capital expenditure, which accounts for almost 22 percent of the marketplace.
As the following chart demonstrates, capital expenditure is the sole cause of recessions when growth turns severely negative in any year (more than -8 percent).
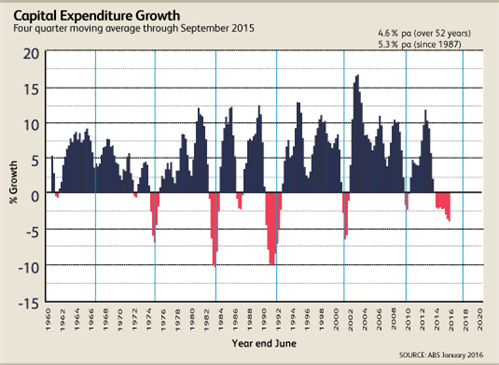
While the crash in mineral prices has affected mining investment – which was a quarter of all capital expenditure at its peak in 2014 – the negative growth in the year through September 2015 for total capital expenditure was limited to -4 percent.
We just might see the negative performance in 2016 limited to -2 percent if the boom in housing construction and new infrastructure continues throughout the year. We can but hope.
Business capital expenditure makes up the bulk (near 60 percent) of all capital expenditure, and while it is still likely to be negative in 2016, there are signs of confidence emerging in that sector, helped by the new PM’s cajoling.
Indeed, the current positive for the economy is the new PM, like NZ’s John Keys, who is commercially and politically bloodied and savvy, reformist, upbeat and – so far – popular and steadying.
So, continued growth is expected for consumption expenditure: it has not been negative since the end of World War II. Growth in exports rarely goes negative. And, hopefully, a not-too-negative capital expenditure year, as this is the only cause of recessions in the economy, when it collapses like in 1982-83 and 1991-92.
So it will be another growth year for the economy, but not enough to make a big dent in the unemployment situation (5.9 percent in November 2015). But we are again likely to create three to four times more jobs than we lose in 2016, as we did in 2015.
IBISWorld’s outlook for the nation’s GDP is shown in the chart below.
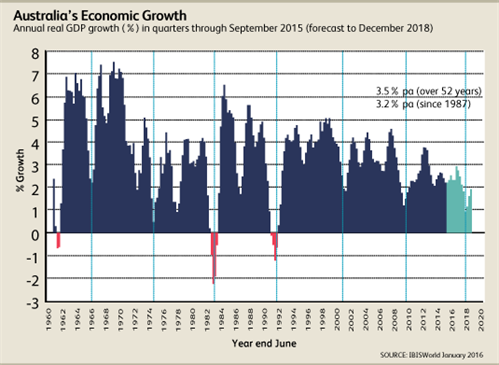
Any talk of recession is premature. If we were to be vulnerable to one, it would be in 2017-18 at the end of the normal eight-and-a-half-year business cycle.
Certainly the world economy will be vulnerable at that point, having not reduced national debts since the GFC in 2009, still running government deficits and facing some rise in interest rates to appease lenders.
But if Australia can stave off the cause of recessions – a fall of over 8 percent in capital expenditure – in 2017-18, we could yet again avoid a recession and move on to an unprecedented three-plus decades of uninterrupted growth since our last one in 1991-92.
As important as the market pull is to the economy, the production push is vital when it comes to innovation, productivity and competitiveness. But which leads to the better outlook for industries?
In 2016, the best growth is likely to come from health, hospitality, mining and telecommunication companies. The slowest growth is likely to be in manufacturing, utilities, transport, and administration and support services. All other industries are expected to grow at a rate similar to GDP, plus or minus a bit.
In the case of productivity, the best growth could be expected to be mining (a condition of survival), utilities, finance and construction.
The laggards, needing innovation and panel-beating, are likely to be: professional and technical services; arts and recreation; health, administration and support services; and transport and postal services.
The bottom line
In conclusion, 2016 will be another slow growth year; just a bit better. But an important year to start addressing the malaise in our economy of nearly 10 years as a result of poor leadership, lack of reforms in IR and taxation, insufficient innovation and patchy productivity.
Nearly everybody knows this; it is just a case of getting on with it.